
Sales and Success Metrics

Companies that stage their growth to scale are fundamentally more successful and resilient than those that grow without measurable business outcomes.
Our friends at Insight Partners agree with our view that scale should be staged, and believe in this principle so heavily that their entire portfolio is managed around these essential "scaleup" milestones. In this paper, we'll look at the stage indicators and corresponding sales and customer success metrics that are reliable predictors (and essential prerequisites) for growth.
Table of Contents
Early Stage (< $10M ARR)
At the earliest stages of scaling, sales and customer success ("CS" or "success") metrics give us an indication of what your company is becoming. They also give a sense of whether the product has achieved product-market fit - what's the potential of the product and which types of customers are most likely to buy. As an investor at this stage we're looking for companies that:
- Solve a broad, real market problem in a large market.
- Close a high proportion of the sales opportunities they encounter.
- Add new customers and drive revenue growth at an exciting pace.
- Have happy customers that renew their contracts.
Four sales and success metrics are fundamental to Early Stage success: Win Rate, New & Expansion Bookings Growth Rate, Gross Revenue Retention (GRR), and Net Promoter Score (NPS).
Early Stage Indicator #1: Win Rate
| Metric | What it means | How to calculate it |
| Win Rate | The portion of sales opportunities that are won | $ value of Opportunities Won / ($ value of Opportunities Won + $ Lost) |
Win Rate is one of the most foundational metrics in sales - how many times do you win when a decision is made? Win Rate indicates three things for this ScaleUp stage: 1) lots of prospects are engaged and like the solution - i.e., overall market demand; 2) the solution meets their needs, so they purchase - i.e., a measure of product-market fit; and 3) your GTM team has the skills to close the deal - i.e., sales execution.
While Win Rate helps you understand the strength of your sales execution and the overall demand in the market, it also identifies the pipeline coverage ratio that your team needs to achieve their target. Required Pipeline Coverage is calculated as (1/Win Rate). That means if you have a 20% Win Rate from sales qualified opportunities, you need 5X your target in pipeline to hit your goal.
For new logos, we like to see Win Rates of 20-40%. If Win Rates are higher than 40%, then you're probably qualifying out too many deals early in the process and missing out on market demand - or you are underpricing for the perceived value of your offering and missing out on revenue. Expansion Win Rates (both cross-sell and upsell) should be between 40% and 85%. Rates of this level show that your customers understand the value of your product and want to either buy more of it or buy ancillary products to expand the value. Overall combined Win Rates (at the Early Stage of scaling) should be around 30%.
How can you improve this indicator? There are a few paths to addressing low Win Rates.
1. Implement a deal qualification framework - Early Stage ScaleUps often lack clear qualification processes to determine if the opportunity is viable. Implement one of the many qualification strategies (BANT, ANUM, etc.) and ensure that your sales and SDR team can use that qualification to move only on viable opportunities into qualified pipeline.
2. Standardize your sales methodology - Early Stage ScaleUps hire experienced sales reps who know how to manage a sales process. While many reps do have clear views on how to do this, the approach may differ from rep to rep. This leads to inconsistencies within your team and can drive low Win Rates. By using a single, standardized sales process and methodology, you can align your sales team and ensure that everyone is clear on expectations, sales stages, and that your Win Rates are accurate.
3. Formalize your forecasting process - The best way to drive your Win Rate and make your sales team better is to do pipeline inspection and forecasting calls. Pipeline inspection is a detailed walkthrough of core opportunities expected to close in period. Rather than simply ask "When is this deal going to close, and are you committing it?", best practice is to dig into the timing and recent activities; understand the decision makers, champions, and influencers; and map the decision-making process. With closer deal inspection, you'll find those deals that aren't progresisng and either close them as lost (freeing up sales resources for more viable deals) or put additional focus on them. This effort may have a short term negative result on Win Rates as you clean bad deals out of your pipeline, but it will yield better Win Rates over the long term and lead to accurate forecasting.
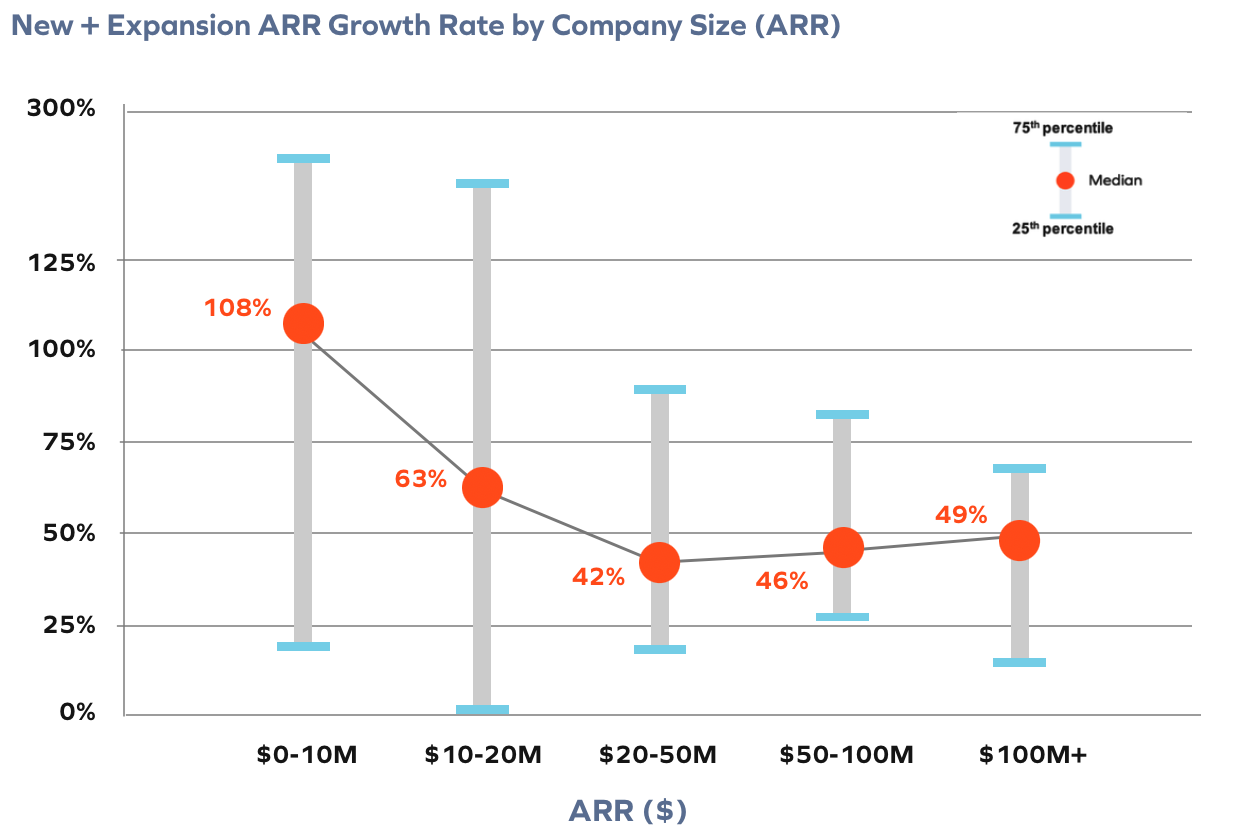
Early Stage Indicator #2: New & Expansion Bookings Growth Rate
| Metric | What it means | How to calculate it |
| New + Expansion ARR Growth Rate | Percentage change in New + Expansion ARR between Current Year and Prior Year | (New + Expansion ARR T) / (New + Expansion ARR T-1) -1 |
The next core element is all about growth - both new logo business as well as all cross-sell and upsell. This ratio is the clearest indicator of go-to-market traction within an organization. In the Early Stage, growth rates should be over 100%, but as the company scales, maintaining that level of growth gets harder. In later stages we'll look at the New vs. Expansion Bookings Mix and what it means for long term growth, but in the Early Stage, mix isn't as important as overall bookings growth.
How can you improve this indicator?
1. Evaluate your lead flows - The first step in driving greater growth is to evaluate your various lead sources - events, marketing, outbound sales, partners. Increase the funding of the lead sources that are driving the highest quality leads. This could mean participating in more events, spending more on marketing or partner development, or expanding the direct or indirect sales teams. In Early Stage ScaleUps, growth is paramount; short term spending that worsens CAC Payback may be necessary to fuel growth in new logos, which in turn offer potential for upsell and cross-sell. Even at this Early Stage, you should review your customer base to ensure you are bringing in customers who will stay a long time and profitably expand their relationship with your company. A common mistake we see at this stage is to sign up every customer in order to grow - this strategy will lead to higher churn of customers who don't fit your ICP (Ideal Customer Profile).
2. Establish a repeatable sales process - A consistent, repeatable sales process is the foundation of scaling. Early Stage ScaleUps need to shift away from founder-led sales processes to stable, consistent processes modeled on best practice. This means having sales reps, rather than founders, find, cultivate, and close opportunities. It also means hiring your first VP (Head) of Sales who can recruit and develop those sales reps, establish standard processes, implement new tools and build out a repeatable sales motion.
3. Differentiate new and expansion motions - In the earliest stages of growth, sales reps sell everything - new as well as upsell and cross-sell - and most likely manage the renewals, too. This works to a point, but it's challenging for reps to appropriately prioritize all these different responsibilities. Some reps will focus on the largest opportunities even though they take a lot of their time. Others will focus on small quick wins to chip away at their quotas. At some point, things will get neglected. Rather than leave that responsibility to the sales reps, you need to differentiate the new logo motions from the expansion motions and create discrete teams and processes for each. This gives you better visibility into which motions are working and aligns reps to specific motions based on their skill set. To get a sense of when the tiping point is, monitor new logo and expansion opportunity count; when you see the number of new logos dipping below historical norms, start that evaluation of when and how to split the roles.
Early Stage Indicator #3: Gross Revenue Retention (GRR)
| Metric | What it means | How to calculate it |
| Gross Revenue Retention (GRR) | The percentage of recurring revenue retained from the prior year, excluding the impact of upsell and cross-sell | For customers that existed exactly 12 months ago: ($ ARR this year less their upsells and cross-sells) / ($ ARR last year) |
Gross Revenue Retention (GRR) gives a strong indication of the stickiness of the product and the value that your cusotmers are getting from the solution. GRR looks exclusively at the change in revenue from your existing base, excluding any upsells and cross-sells. Think of your overall revenue as a large bucket. However, there is a leak at the bottom of that bucket (customer churn and downsells). GRR measures the size of that leak. If GRR is high (e.g., 95%), that means that the revenue leakage is low and nearly every dollar of revenue generated by sales brings the water level higher. Low GRR (e.g., 65%) means the leak is larger, and a higher portion of the sales-regenerated revenue is simply replenishing the bucket before it continues to growth. Low GRR makes consistent growth far more challenging.
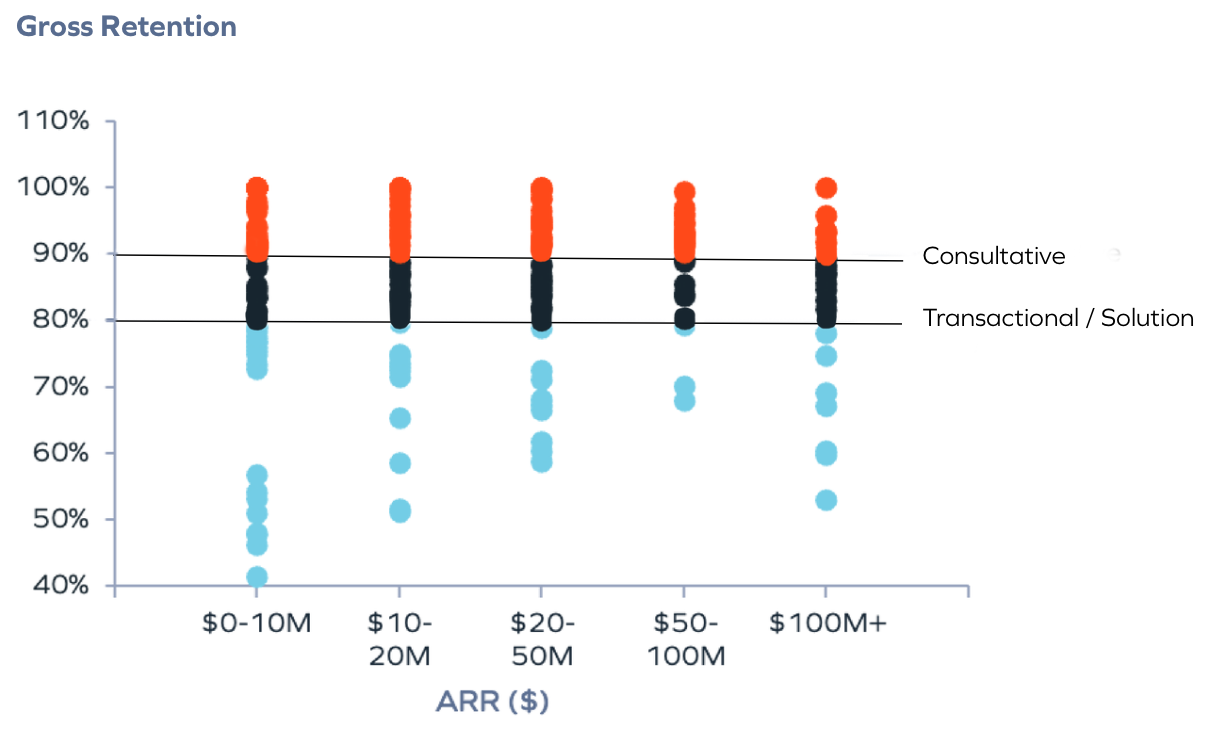
In Insight's dataset, GRR ranges from 60-100%, with the most successful companies sustaining and growing this metric over time. Companies with more consultative sales motions and large deal sizes achieve the higher end of the range, as those contracts are often multi-year and those products stickier because of systems integrations. Since Early ScaleUps have fewer customers, this metric can be more volatile, especially when ARR is under $5M or when there is a concentration of revenue in just a few customers. Over time, GRR should stabilize at a high rate (>90%) and, because Mid and Late Stage ScaleUps rely more on growth from existing customers, GRR becomes more and more important.
How can you improve this indicator?
1. Focus on the onboarding process - We at Technocery believe the renewal is won in the first 90 days after closing the sale. A formal onboarding process ensures that your customers get the value they expected from your solution, which increases retention and improves your chances for expansion. In the first 30 days, establish clear communications with the customer and truly understand their use case. You'll want to build out a customer profile that details who the key influencers and users are and their goals for the solution. In the next 30 days, build out a targeted customer success strategy that maps out the customer touchpoints and escalation plan. In the final 30 days, begin the pattern of regular check-ins and quarterly business reviews (QBRs) to ensure that the customer is realizing value. By creating and standardizing the onboarding process, you can be certain that all customers realize the value that sales promised them, leading to renewals and expansions.
2. Ensure that the sales pitch is consistent and doesn't oversell the solution - In Early Stage ScaleUps, the founder is often the primary sales rep. Over time, new reps learn by shadowing the founder. At some point (typically around 3-5 reps), the founder steps back from day-to-day selling and reps lose the chance to see how the founder pitches the solution. That's when the "game of telephone" kicks in - new reps learn the pitch from established reps who learned the pitch from another rep who learned it from the founder. The pitch changes and may no longer reflect the actual capabilities of the solution. If the pitch deviates too far, then customers may be disappointed once they go live. Use a Conversational Intelligence tool (e.g., Salesloft, Gong, Chorus.ai) for monthly inspection of the pitches that the sales team delivers to ensure it meets your standards. Host "Pitch-o-Ramas" where reps compete against each other to see who delivers the best pitch and win prizes.
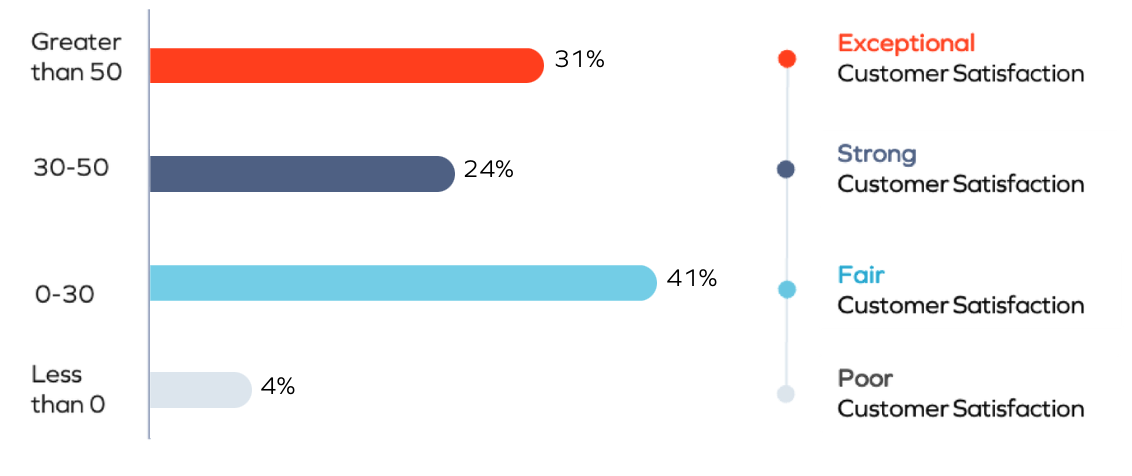
Early Stage Indicator #4: Net Promoter Score (NPS)
| Metric | What it means | How to calculate it |
| Net Promoter Score | A measure of customer satisfaction. The percent of customers that would recommend the product to an acquaintance (on a scale of 0-10). 9-10 are considered promoters; 0-6 are considered detractors and 7-8 are considered neutral. | % Promoter - % Detractors |
Net Promoter Score (NPS) is a gauge of customer satisfaction, and in the future, willingness to renew. NPS is calculated from responses to a single question: How likely is it that you would recommend our product / solution to a friend or colleague? At -100% everyone is a detractor; at +100% everyone is a promoter. For enterprise SaaS ScaleUps an NPS of 30-50% is considered strong and 50%+ is exceptional. Run the survey with caution: reps tend to survey customers / users that they know are happy to ensure good results. Periodically the leadership team should test the scores through customer conversations to understand how customers perceive product value. Ultimately, regular NPS analysis provides trends in customer sentiment allowing you to make necessary adjustments to ensure that your customers are happy and that retention stays high.
Early Stage ScaleUp Example
The foundations of long-term revenue building are easy for investors to recognize when they see the early signals that customers love the product and that it is easy to sell.
Now that we've identified the key metrics to determine if an Early Stage ScaleUp company is on a long-term path to success, here's an example to illudstrate how Insight's investors look at two comparable companies that are in their second year since product launch.
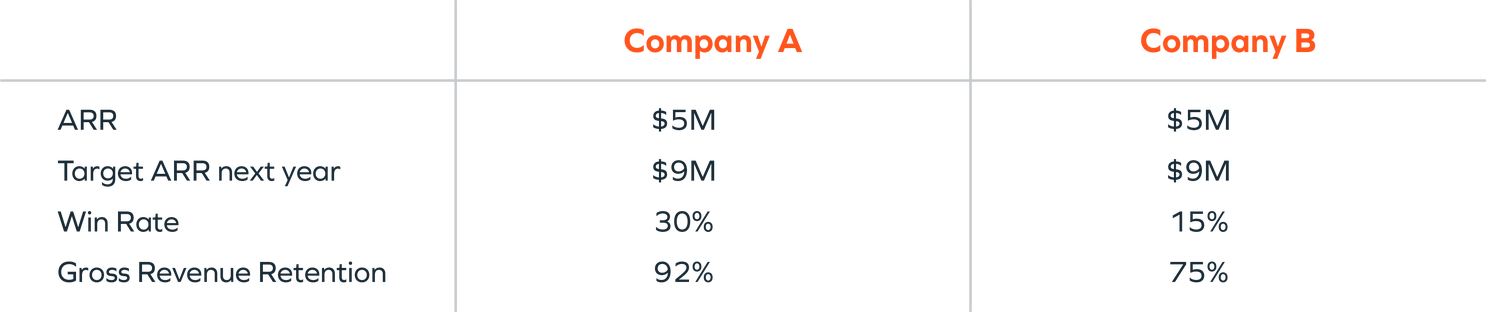
Both companies have $5M in ARR with a target of $9M (80% growth), but their Win Rates and GRR are very different.
Let's look first at Win Rate. With no churn or downsell, to get to $9M, they need to close $4M in new and upsell bookings. Company A needs to create $13M in pipeline ($4M / 30%), while Company B must work twice as hard and source $27M in pipeline - for the same outcome.
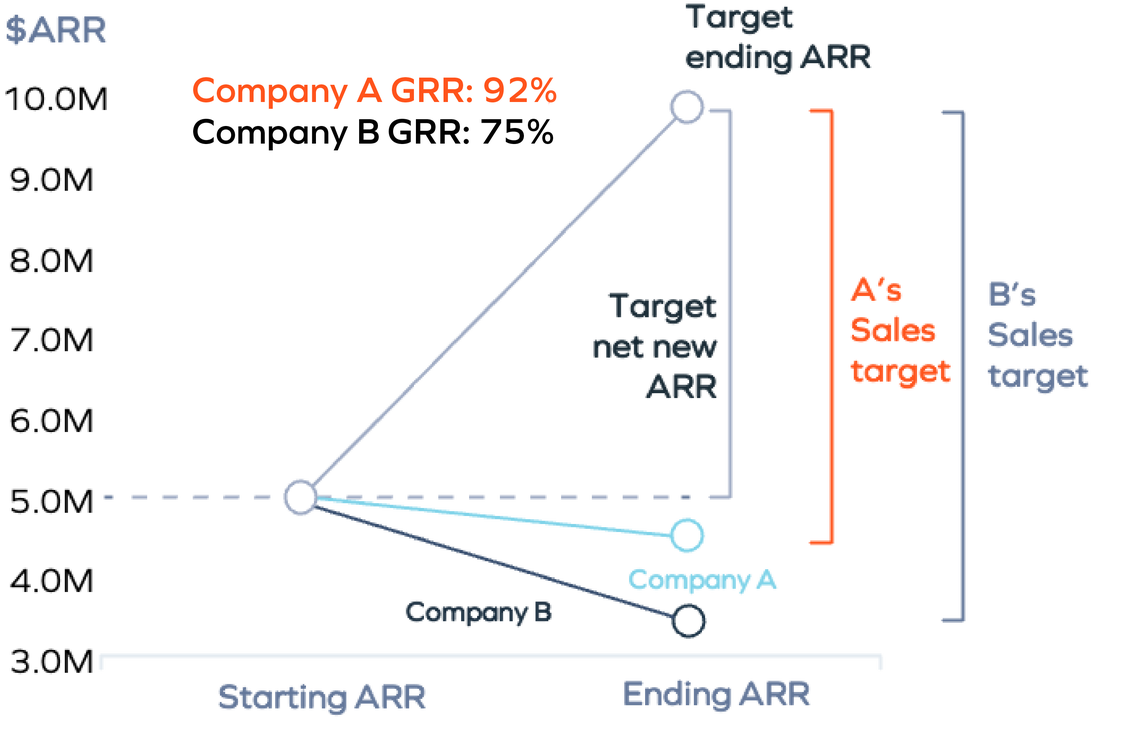
Now put aside new bookings for the moment. Company B suffers from a leaky bucket: 75% GRR as compared to Company A's 92%. Company A will lose $400K by the end of the year, while Company B will lose $1.3M in revenue. That means that Company B's sales team must close $1.3M in new sales just to keep ARR level.
Now combine the two metrics (Win Rate and GRR) and the effects are compounded. To end next year at $9M in ARR, Company A must add $4M in net new bookings and replenish the $400K of churn and downsell, requiring ~$15M in pipeline ($5M / 30%). Company B, however, must source ~$35M in pipeline, about 2.5x as much, to get to the same place. That's a massive uphill climb for Company B, and this issue will only multiply as they scale.
Early Stage Summary
The four basic metrics an Early ScaleUp needs to track show critical information about a company's ability to build a repeatable sales motion, which is the foundation for growth. At this Early Stage, market size being equal, companies with higher Win Rates, GRR, and NPS will command greater valuations, and likely burn less money en route to scale and profitability.
Mid Stage ($10M - $100M ARR)
In a ScaleUp company, the second act is often the hardest. Your company goal is to double down on what worked in the Early Stage, turning into a machine that captures market share and manages the balancing act between new logo growth and customer expansion. You'll recruit experienced leadership to manage increasing business complexity - and there are even more signals coming in for you to sift through.
Growing from $10M to $100M in ARR requires this executive team to make bets on new markets, new products, or new segments without stretching yourself or your company too thin. Beyond that, it takes longer than you might think to see the results of these GTM strategies: marketing dollars spent today will take weeks to generate leads and even longer to generate revenue. Similarly, reps hired today will take months to ramp to full quota.
As an investor, we're looking for companies that:
- Spend money efficiently to acquire new customers and expand within existing customers.
- Identify new avenues of growth and move to capture them.
- Maintain and grow the revenues of existing customers.
- Continue to add new logos at a high rate.
To guide you along these objectives, we recommend managing three core sales and customer success metrics for Mid Stage ScaleUps: Customer Acquisition Cost (CAC), Net Revenue Retention (NRR), and New vs. Expansion Bookings Mix.
Mid Stage Indicator #1: Customer Acquisition Cost (CAC) and CAC Payback
| Metric | What it means | How to calculate it |
| Customer Acqusition Cost (CAC) | The amount of sales and marketing dollars spent to acquire one new customer | S&M Expense / # of New Customers |
| CAC Payback | The number of months required to recoup the investment of acquiring a new customer | S&M Expense / (New + Expansion ARR) * 12 |
Customer Acquisition Cost (CAC) is the amount of money that you spend on sales and marketing to generate a single new customer.
CAC Payback converts CAC into the number of months of ARR it takes to recoup the sales and marketing investment that obtained that revenue. It is the single most important measure of GTM efficiency.
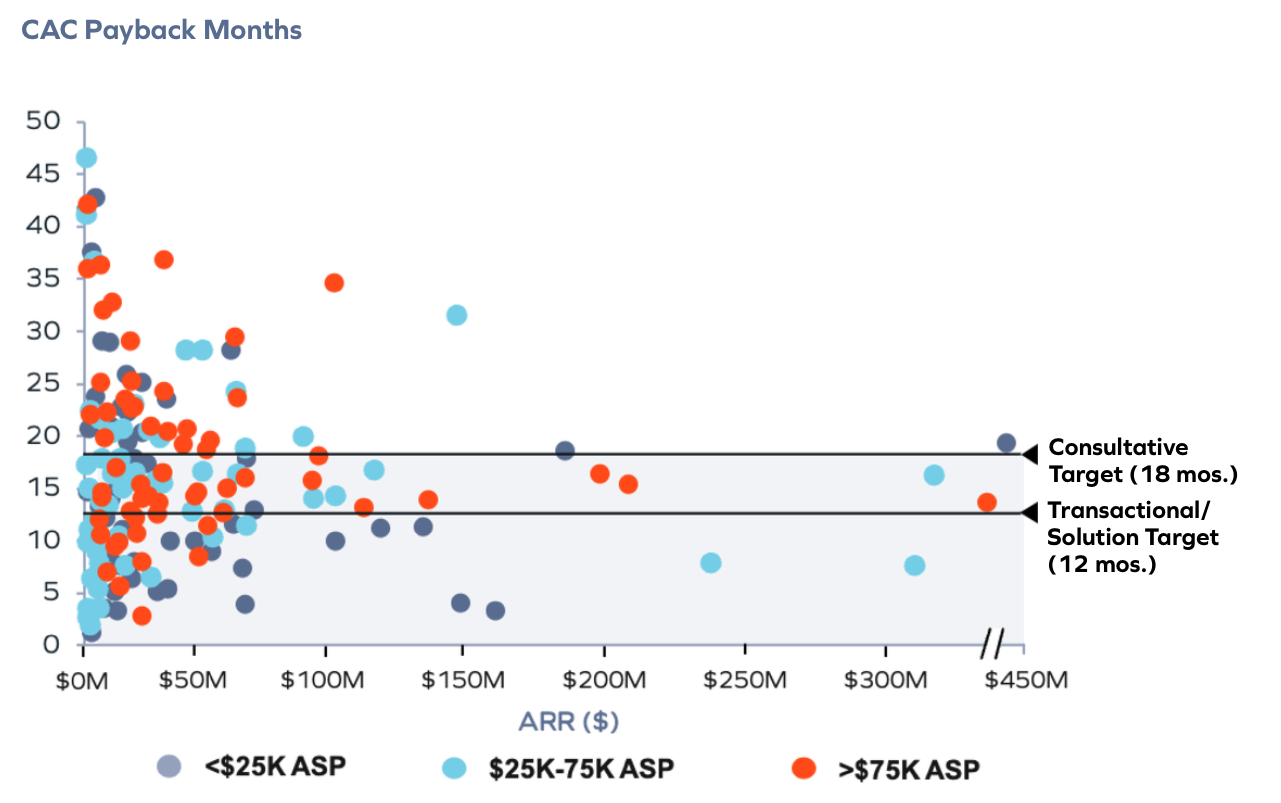
CAC Payback of 12 months or fewer is a widely accepted benchmark of success, but realistically CAC Payback will change based on where you are in the scaling journey and the types of investments you're making in your go-to-market organization. During Early Stage (< $10M of ARR), you're in trial-and-error, and our dataset shows wide variability in this measure of GTM efficiency. You're investing heavily in the resources and infrastructure to generate revenue over the next few years, so in general, your CAC Payback is longer (inefficient). As you scale to the Mid Stage, CAC Payback should improve as you become more efficient in targeting and closing prospects, particularly in your core market. But even at the Mid Stage, you're still investing heavily in sales and marketing: as you unlock new growth vectors, you'll experience trial-and-error in those new markets, customer segments, and products. And since those investments don't pan out for a few years, you should expect efficiency to bounce slightly over time. In the long run, however, CAC Payback should recover and trend toward that 12-month (or better) goal.
How can you improve this indicator?
1. Increase employee retention and productivity in sales - Two things improve CAC Payback: 1) more revenue with the same spend or 2) the same revenue with less spend. Consider the former. Adding new sales reps is a huge driver of revenue but it takes a long time to hire and ramp a new rep. A faster path to revenue is to make your existing sales team more productive through onboarding, training, and new tools. Insight sees an 8-10% improvement in productivity through improvements in training (both product and skills) and the use of appropriate tools. If you have a sales team of 10 people, that's the equivalent of adding one new sales rep that is immediately productive. Since most Mid Stage ScaleUps have 20+ sales reps, productivity improvements can have a massive growth impact.
2. Double down on successful marketing and sales spend - Early in your scaling journey, you may have tried a variety of different marketing methods and sales efforts. In Mid Stage it is time to re-evaluate and rationalize that spend, which means doubling down in some places and cutting it in others. Analyze the conversion rate of different lead generation sources and focus your marketing or sales spend on those areas that generate leads with high Win Rates.
Mid Stage Indicator #2: Net Revenue Retention (NRR)
| Metric | What it means | How to calculate it |
| Net Revenue Retention (NRR) | The percent of recurring revenue retained from the prior year, including the impact of upsell and cross-sell | For the customers that existed exactly 12 months ago, $ ARR this year / $ ARR last year |
Net Revenue Retention (NRR) - which measures how much your customer base is spending today as compared to a year ago (including the impact of churn, downsell, and upsell / cross-sell) - is arguably the most important indicator of a company's commercial success and potential. It is an all-in-one summary of product-market fit, customer happiness, and organic revenue growth potential. It's best to measure this on a trailing twelve-month (TTM) basis.
As mentioned in the Early Stage metrics when we discussed GRR, if you look at your overall revenue as a bucket of water, NRR measures the balance between the leaking caused by churn and downsell and the positive impact of upsell and cross-sell. NRR >100% means that your company's growth from existing customers is more than offsetting the churn - the water level in the bucket is rising even before sales adds new logos. This means that every dollar of revenue generated by sales goes directly to growth. NRR is the super-accelerator metric: small increases in NRR compound to have exponential results. All else being equal, a company with 160% NRR will be four times larger than the same company with 120% NRR after 5 years. And of course, investing in new logos will only add to that growth.
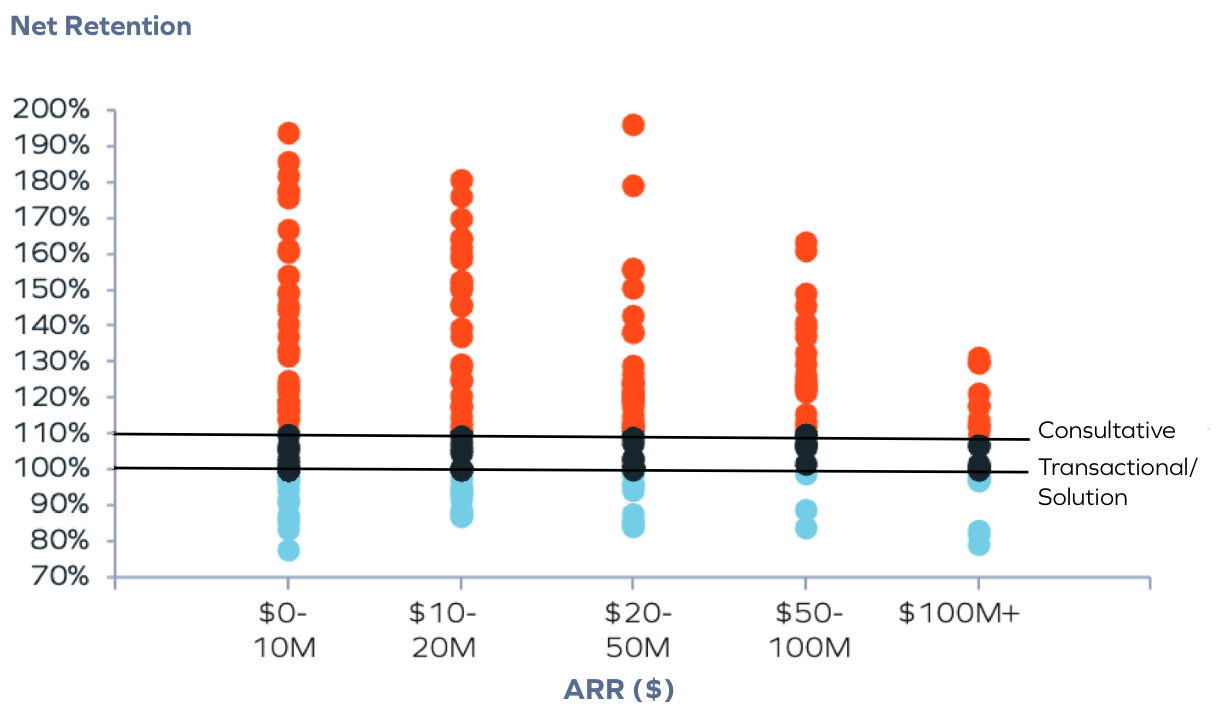
NRR below 100% is a clear sign that you have challenges with your existing customer base, and by implication, product value. You also haven't yet develped a good process to drive cross-sell or expansions. The sales team will need to work much harder to grow revenue through new logos to make up for churn and limited expansion which puts long-term, consistent growth at risk.
One caveat: while NRR is extremely important, it is also important to continue to focus on GRR since a very strong NRR may mask potential churn and downsell issues.
How can you improve this indicator?
1. Evaluate your pricing and packaging - Pricing and packaging are key levers in driving expansion (upsell and cross-sell). Often we find that your Early Stage pricing structure lacks volume-based tiers that actively encourage upselling. If you've added new products, these may not be configured in bundles that encourage customers to add additional products or modules. A pricing and packaging review can have a significant impact on long-term revenues and is a key initiative as a company moves through the Mid Stage scaling journey.
2. Build a customer success organization - In Early Stage, a few customer success reps can drive adoption and value realization. By the Mid Stage it is time to create a robust customer success organization. With the addition of an experienced customer success leader, dedicated CSMs and CS Operations, you'll further reduce churn and ensure organic growth from a happy customer base. A CS organization also provides feedback to your product team, which ensures your product meets the market's needs. (There is no shortage of information across the industry demonstrating how an investment in CS would impact your company's financials.)
3. Tier your sales and support to focus on high value targets - By this point your customer base is larger and you have built out organizations to support it. By tiering customers to give them the appropriat level of support, you'll be able to maximize the impact of your CS investment. Not all customers are equal - some carry significant weight in the market and act as a reference, others may have material expansion potential; these customers should receive your highest levels of support. Customers with lower potential lower support needs should shift into a lighter support model; customers that are less profitable may be best supported in a tech touch support structure. Tiering support allows you to spend your valuable support resources on managing and cultivating customers based on their needs and potential.
Mid Stage Indicator #3: New vs. Expansion Bookings Mix
| Metric | What it means | How to calculate it |
| New Bookings vs. Expansion Bookings Mix | A measure of the percent of revenue from new logos vs. the existing customer base | New ARR / (New + Expansion ARR) |
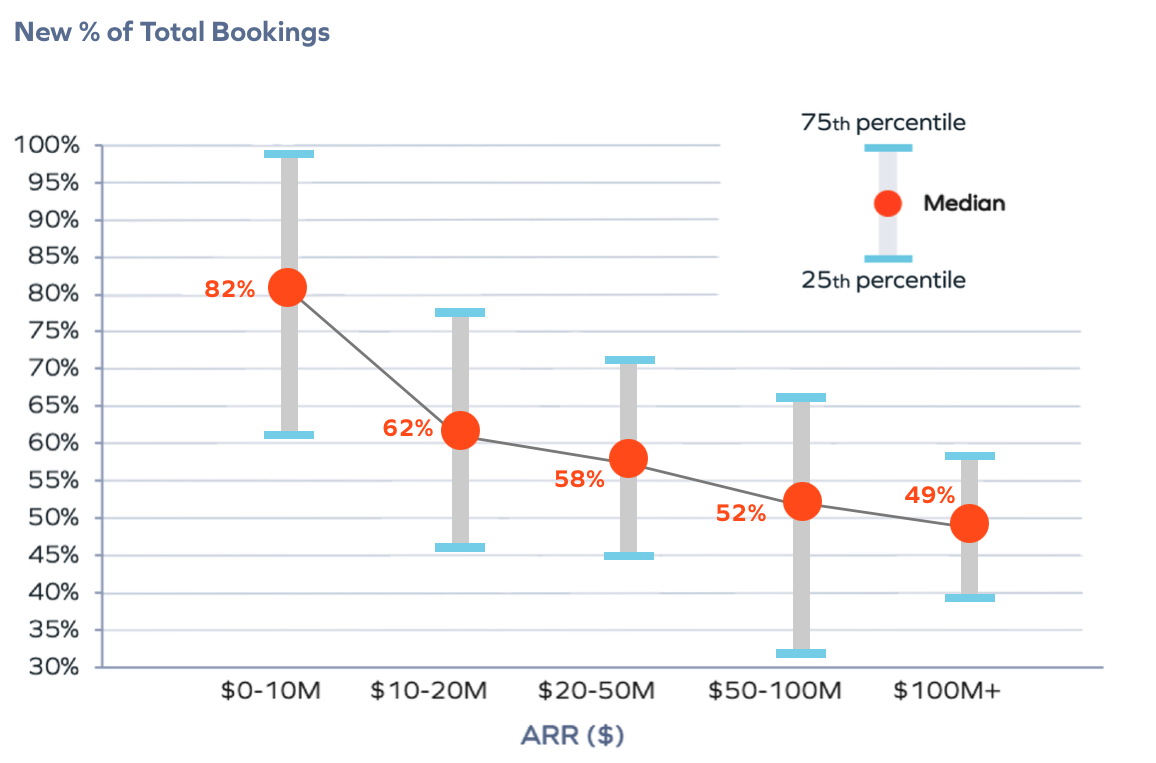
New vs. Expansion Bookings Mix (or just "Bookings Mix") measures how much of your total new revenue comes from new logos vs. from expanding with your existing customers.
Early in a company's maturity, the Bookings Mix leans heavily towards new logos (80%+) since your existing revenue base is relatively small and expansion opportunities are limited. As revenues continue to grow, the balance will shift towards expansion. As you scale from $10M to $100M ARR, your percentage of bookings contributed by new logos might drop to approximately half of your total bookings.
How can you improve this indicator?
1. Create specialized functions in customer success - To ensure appropriate prioritization of activities by CSMs and a balance between customer retention, expansion, and renewal activities, many companies establish discrete teams for renewals and collections. This allows the adoption and retention customer success teams to focus on the engagement with the customer and drive usage and expansion.
2. Create specialized functions in sales - To focus activity on specific goals, Mid Stage ScaleUps split out new business-focused account executives and expansion-focused account managers. You may also find success in product-focused sales specialists that can support both the new logo sales and expansions to the customer base. Solutions Architects and Subject Matter Experts are common roles that support new and expansion sales motions.
3. Develop expansion campaigns - To drive expansions, run drip campaigns (automated emails to potential customers at set time intervals or after interacting with your company) to stay in constant communication with your customers and use lead scoring (just like with new prospects) to determine with whom and when to engage.
4. Implement product-based upsell opportunities - By establishing pricing that is based on seats or consumption, you can extract upsells without diverting sales resources to drive that incremental revenue. Similarly, incorporating additional features within the product that encourage customers to upgrade to higher levels of product also requires minimal sales and marketing efforts but can yield material expansion revenue.
Mid Stage ScaleUp Example
Efficiency as Scale Accelerates is the name of the game for Mid Stage, and here investors look for businesses with strong growth prospects and indications of capital efficiency. Companies that can go from $10M to $100M ARR with efficient use of sales and marketing spend will be viewed by investors as higher quality and command a higher valuation multiple.
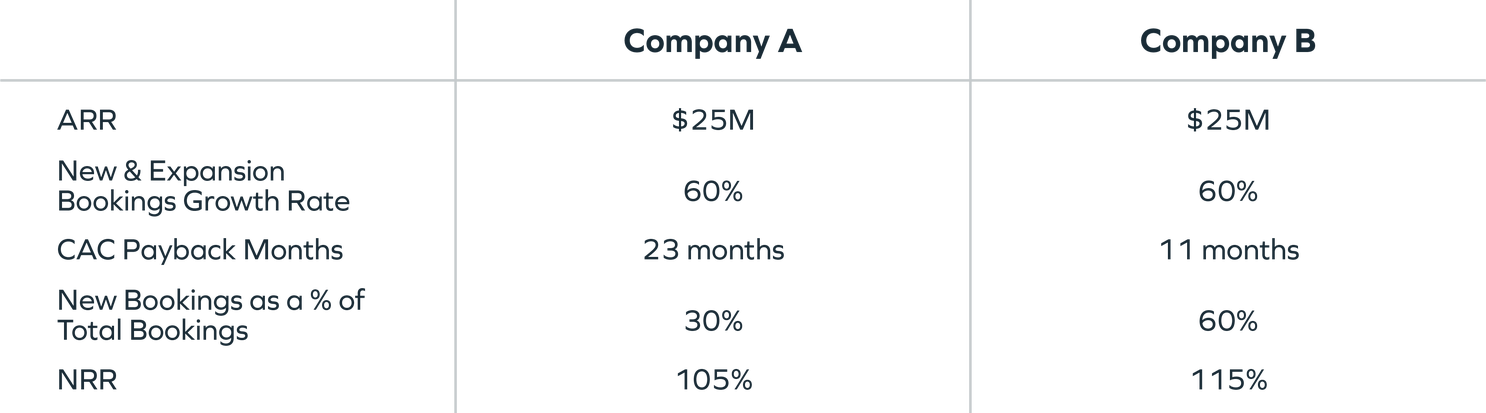
In our comparison of two companies, while both companies are at $25M of ARR and growing bookings at 60% YoY, Company B has a few advantages. First, CAC Payback Months indicate that the business requires half as much sales and marketing spend to bring in the same amount of revenue as Company A. That is a significant level of efficiency that allows for increased investment in net new, or margin advantages over Company A.
Company B alao has a higher NRR. This is despite the Bookings Mix being less concentrated on expansion than Company A. Since NRR is based on both expansion revenue as well as churn and downsell, we can determine that there is significantly more churn and downsell in Company A. This erosion of the customer base puts a lot of pressure on Company A, which gets 70% of overall revenue growth from existing customer expansion. If we factor in the lower level of sales efficiency (23 months CAC Payback vs. 11 months), Company A will struggle to keep pace with Company B.
Mid Stage Summary
The three additional sales metrics for Mid Stage ScaleUps (Customer Acquisition Cost and CAC Payback, NRR, and New vs. Expansion Bookings Mix) provide visibility into your company's ability to scale efficiently and the long-term growth and profit potential. High CAC may indicate inefficiency, poor product value, or a highly competitive market. NRR indicates opportunity upside and market size. Less New Logo ARR in the Bookings Mix will yield better margins. It's obvious but worth stating: if you're best-in-class in all of these metrics, you'll have investors pounding on your door.
Late Stage ($100M+ ARR)
Late Stage ScaleUps who have crossed the $100M ARR milestone are in a whole new stratosphere. You have established clear product value and can scale efficiently. At this point, investors like Insight Partners expect to see a clear strategy for repeatable, consistent growth.
Just like a Boeing 787 Dreamliner which collects 5,000 different data points each second, the metrics tracked in your ScaleUp have grown exponentially. And with several years of selling and hundreds of sales cycles / renewals completed, these metrics are even more meaningful. To manage a company of this size, you need a team of experienced professionals, and you need a detailed dashboard by company function to keep an eye on the most important metrics. Executives will use this data to identify which areas to invest in, where to intervene, and where to scale back. At this stage, intelligent and efficient use of capital and resources is key. You might need to make difficult tradeoffs by geography, customer size, vertical, or other factors, which is a sign of strategy and focus.
With focus, you can present a strong case for efficiency and profit potential. As an investor, we're looking for companies that:
- Have a repeatable, efficient Go-to-Market motion.
- Have sales and customer success organizations with systems and processes in place to scale to more than $1B in ARR.
- Continuously and efficiently execute on their revenue and margin targets by deploying appropriate resources to achieve strong Return on Investment (ROI).
For Late Stage ScaleUps we focus on three key signals to determine whether a business is on track for success: Sales & Marketing Expense as a Percentage of Revenue, Quota Attainment, and the SaaS Quick Ratio.
Late Stage Indicator #1: Sales & Marketing Expense as a Percentage of Revenue
| Metric | What it means | How to calculate it |
| S&M Expense as a % of Revenue | A measure of the percentage of revenue tied to the dollars spent to acquire the revenue | S&M Expenses / Revenue |
It's easy to get caught up in the chaos to acquire more customers and overlook the steady growth of sales and marketing spend. You're encouraged to chase less efficient growth in the early stages - build your sales and marketing functions and revenues will follow. In Early and Mid Stage, S&M spend was likely 70-90% of your annual revenues. When you're a Late Stage ScaleUp, two things help you become more efficient with your S&M spend. First, you have a stable and growing customer base and new logo growth is a smaller portion of your overall revenue. Typically, due to higher Win Rates and lower-cost resources, the CAC for expansion is significantly lower than for a new logo. The second item that helps you get more efficient is that you're likely starting to rationalize your investments. You've experimented with different marketing and sales approaches and can now focus on the ones that drive maximum growth for the lowest cost.
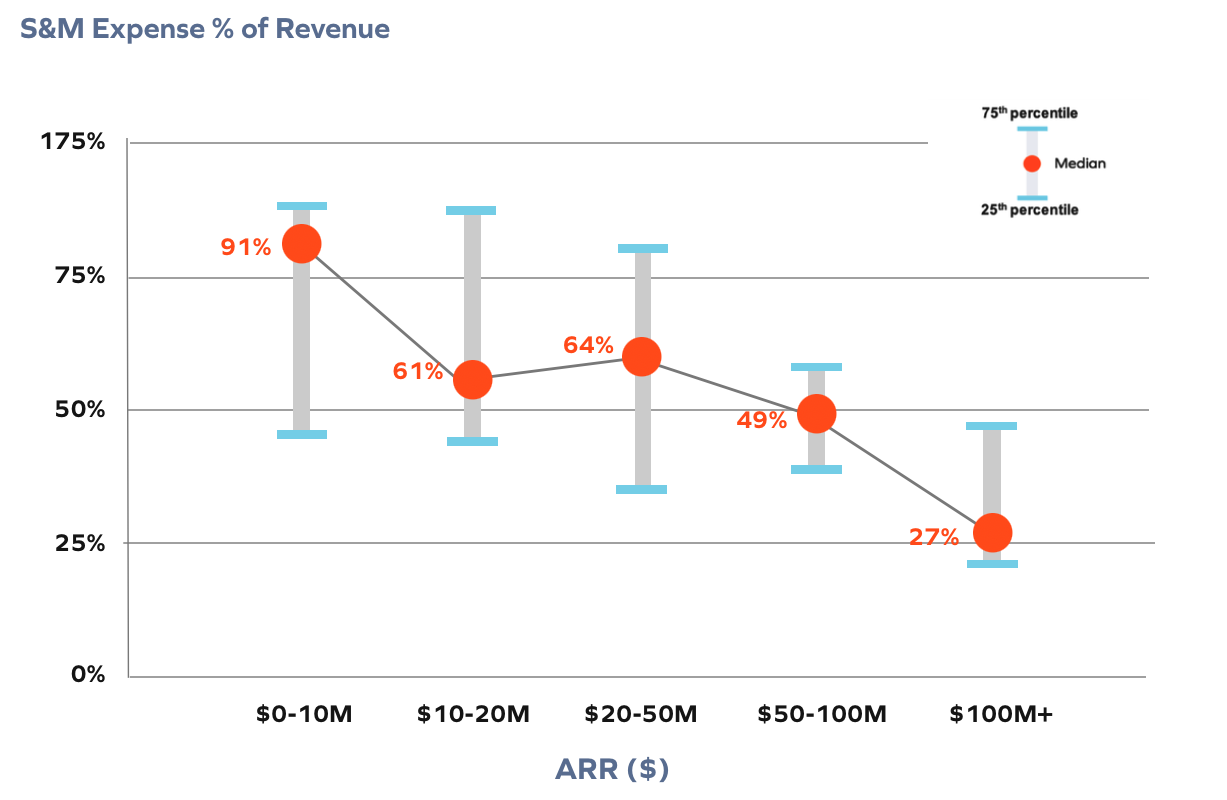
Late Stage growth investors look for companies that are still growing quickly who have brought their S&M Expenses into a more moderate 25-50% of Revenue level. This is a sign of a company who has figured out how to invest their S&M dollars and established their place in the market - evidence of balancing growth and GTM efficiency. It implies that if we invest more into your company, you'll put that capital to use intelligently to increase operating leverage and profitability.
How can you improve this indicator?
1. Rationalize your investments - To get to this stage, you've made several bets. Some have panned out, others not. The best Late Stage ScaleUps constantly re-evaluate their decisions to determine whether those funds can be put to better use elsewhere. Perhaps your success in the UK and Benelux led you to expand into Spain and Italy, but those countries are still operating below break-even; could you repurpose the funds you're spending on AEs and marketing campaigns for those countries to instead double down in the more attractive UK and Benelux markets? Companies in Late Stage must regularly review strategy and reallocate spend to activities with the highest ROI. This requires a Financial Planning & Analysis (FP&A) function with the skills to support structured analysis like ROI and net present value (NPV). It further depends on a data lake that pulls data from disparate systems to create an integrated, business-wide view. Robust systems and analysis are increasingly important for Late Stage companies.
2. Improve sales productivity - In the Early and Mid Stage, the easiest way to increase sales is to add headcount. The market is large and you've captured only a small share, so adding more reps means that you'll be able to engage more prospects and win more deals. In Mid Stage we've discussed the value of improving sales productivity, and this value compounds at the Late Stage. As a simple example, say you have 50 reps with $1M quotas. You could hire one additional rep for $300K who adds $1M in revenue. Alternatively, an investment of $300K in training and tools could increase rep productivity by 10%. That's $5M in productivity gains, or a 25x ROI.
3. Coordinate sales and marketing efforts - Both sales and marketing teams seek to grow company revenues, but their strategies often vary. This friction and lack of coordination leads to ineffective programs. Marketing-led LinkedIn campaigns and direct email to drive awareness in Australia can be more effective if the ANZ sales team is correctly staffed and trained. Similarly, a sales training initiative to build up product knowledge could be amplified by product marketing initiatives around that same product. By coordinating, the two teams can maximize the ROI. To best align the teams, we recommend collaborative, bi-annual strategy sessions across all functions, and monthly meetings between marketing and sales leaders. More on that here.
Late Stage Indicator #2: Quota Attainment
| Metric | What it means | How to calculate it |
| Quota Attainment (% of Rep above and below thresholds) | The percentage of sales quota that a rep achieves. We collect data on the number of reps that achieve different percentages of quota attainment | Number of reps in X quota attainment bucket / Total number of reps |
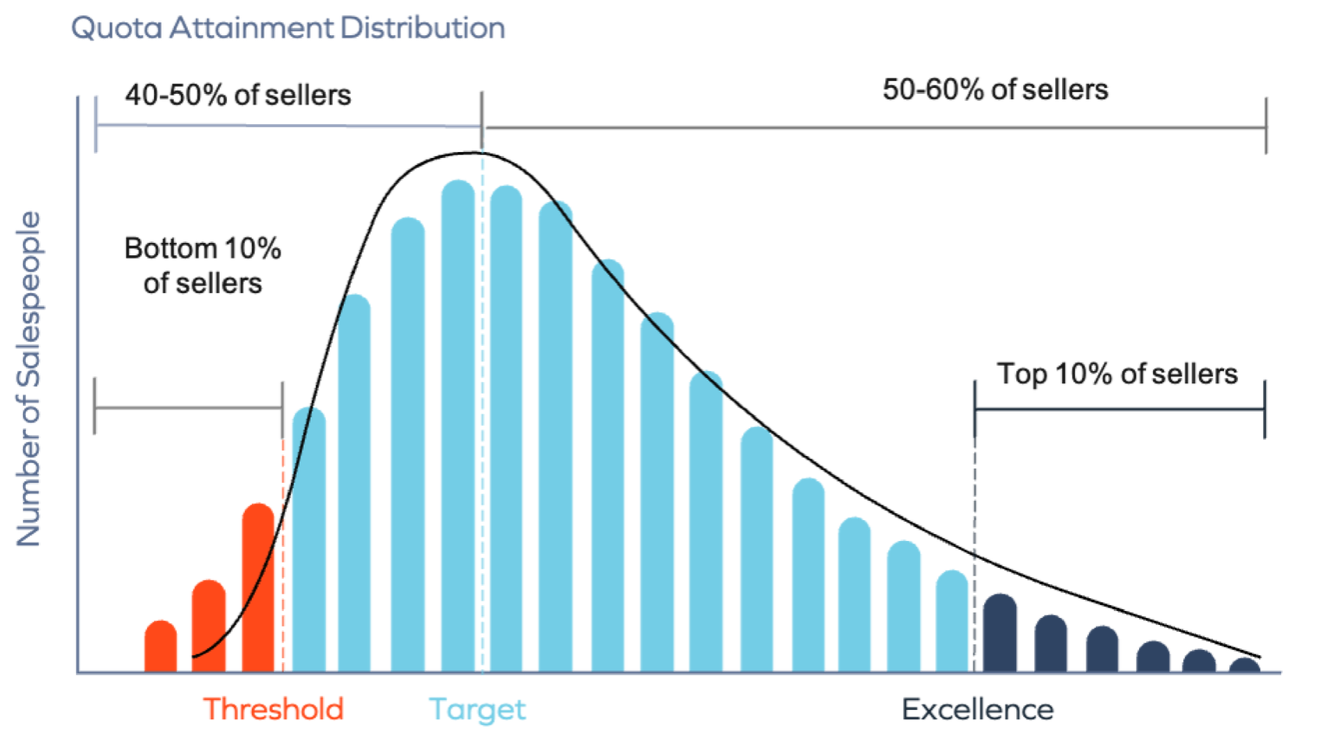
A repeatable, predictable revenue machine requires consistent balanced performance across the sales team as measured by Quota Attainment by rep. This metric helps you understand if your sales force is performing as you'd expect. It also flags a variety of challenges, such as under / overstaffing, poor quota setting or territory design, favoritism, or issues with sales enablement. Best practice is that 50-60% of your reps achieve or exceed their quotas, and 80% should be at 80% or higher.
To understand the impact of rep Quota Attainment, let's look at Company Q with good company performance but poor rep Quota Attainment. Company Q achieved 30% YoY growth and finished the year at 105% of target in aggregate. A closer look reveals that only 6 of their 40 reps finished over plan (15% with 100%+ Quota Attainment) with some stars finishing at 200%+. The other reps ranged from 30-80% of quota. Because most sales compensation plans have commissions accelerators above 100%, the 6 reps who outperformed made significantly more than their OTE while everyone else earned well below their OTE.
This situation prompts several questions: did those 6 have better territories or easy quotas; are they tenured implying newer reps need more training; does Company Q need to model in longer ramp times for new reps; are quotas too unrealistic and hence demotivating for most reps; what is the forecast risk if one of the 6 were to be poached? Since it typically takes 2-3 months to find and hire a sales rep, and another 6-12 months to ramp that rep up to full productivity, the company loses 8-15 months of sales productivity for each rep they lose, and more from each rep that doesn't work out - a major impact to future performance.
How can you improve this indicator?
1. Active rep monitoring and management - Peter Drucker said it first: "you can't improve what you don't measure." The best and most cost-effective way to improve Quota Attainment is to actively measure things that contribute to Quota Attainment, such as discovery meetings, demos, pipeline creation, and late stage pipeline coverage (50%+ pipeline divided by left-to-get). With standardized rep dashboards that include these leading indicators, managers can 1) predict poor performance before it happens, and 2) diagnose their skill and knowledge issues, then devise a plan to upskill their gaps.
2. Eliminate the one-size-fits-all approach to quota setting - Often companies will give every rep in the same segment or market the same quota. Not every territory is created equal unless you've intentionally built territories for equity. The rep selling in Bordeaux likely doesn't have nearly as much opportunity as the rep in Paris or even Lyon, so why assign them the same target? Best practice is to design quotas based on each territory's opportunity using a white-space analysis and applying reasonable Win Rates and timing. If you set quotas based on opportunity, it means that reps are more likely to achieve their quotas, but it also gives you assurance that your top performers really are top performers and aren't just reaping the benefits of a lucky territory assignment.
3. Use reasonable over-assignment - Over-assignment is the practice of assigning the reps more than the actual target that the company wants to achieve. This is done for a variety of reasons including building buffer for rep turnover, putting pressure on leaders to hire more quickly, or ensuring that commission costs don't exceed budget. Quota over-assignments of 5-15% for stable, predictable businesses are reasonable. For higher growth/less predictable companies, consider over-assignments of up to 25% as a best practice. When a company implements an over-assignment of more than 25%, this places undue pressure on their sales teams and risks poor Quota Attainment and demotivation.
Late Stage Indicator #3: SaaS Quick Ratio
| Metric | What it means | How to calculate it |
| SaaS Quick Ratio | A measure for how a company's new dollars compare to the dollars lost from the existing customer base | (New + Expansion ARR) / (Churn + Downsell ARR) |
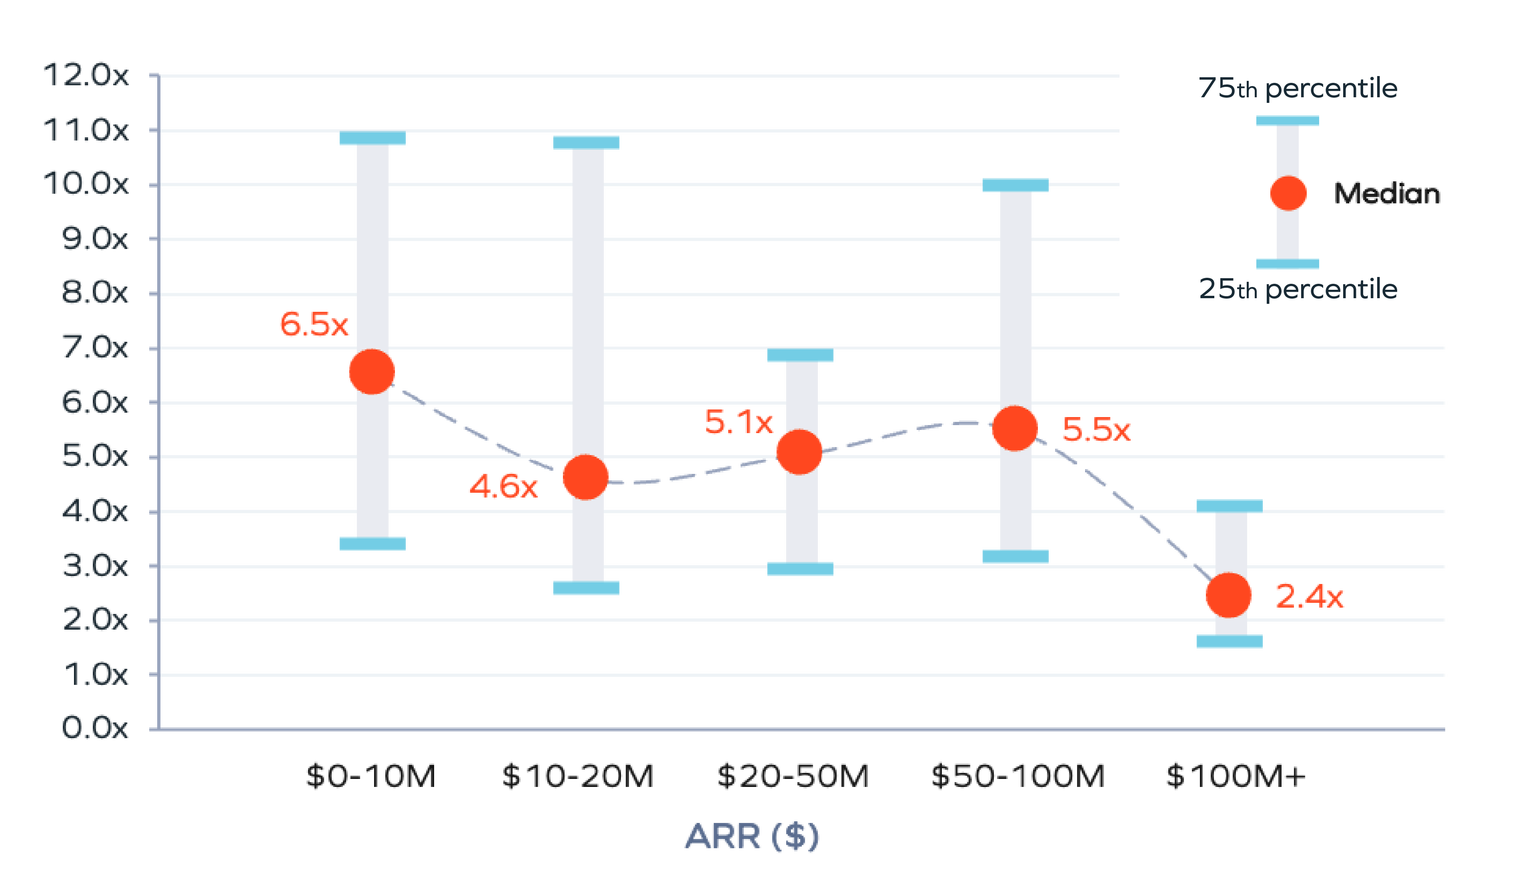
We already know the importance of the inflows of revenues (new logo sales, cross-sell and upsell) as well as the outflows (churn and downsell) in determining the health of your business. A quick way to evaluate the balance between the two flows is to monitor the SaaS Quick Ratio. If the Quick Ratio drops to below 1, then the company is in decline (you're losing more customer revenue than sales can generate) and there are fundamental issues that need to be addressed either in customer success, customer support, product, or selling skills. For ScaleUp companies, even at the high ARR bands, best in class ratios are 4X or higher - where new logo ARR + expansion ARR is 4x the decline in the customer base. This is less than in Early and Mid Stage companies which have smaller existing customer bases, but it's still an indicator of aggressive growth.
How do you improve this indicator?
1. Re-examine your customer health reporting - Ensure you have an early warning system in place to prevent future downsell and churn. Your customer health diagnostic should include key quantitative and qualitative signals that predict churn or expansion, like utilization, support ticket volume, stakeholder engagement, deployment speed, and time-to-value. The best health scores are easily consumed and actionable, and they outline clear paths to resolve or escalate the most common at-risk scenarios. This allows your CS teams to better coordinate to protect your hard-earned revenue.
2. Implement an @Risk call - Your customer base comprises a large percent of your revenue and it's grown so large that you no longer have a pulse on how your customers are doing. At this stage, you should have a program that can spur your cokmpany to action when you're faced with a high value customer that is at risk. @Risk calls are monthly with the executive team and CS reps to discuss renewals or issues facing high value customers. Instead of relying on emails, your leadership team can hear customer issues first-hand and make real-time decisions to address their issues - just like you used to when you were in the early stages of scaling.
3. Expand your CS Operations function - Earlier in your scaling journey, you build out a customer success function to drive valuea nd ensure users adopt the product in a way that addresses their core business objectives. At the Late Stage, your large customer base has diverse needs, so it's time to take this function to the next level with a CS Ops team that can create and fine-tune customer health dashboards and at-risk playbooks, upskill the CS team, automate tasks, run CS capacity planning, and lead renewal and expansion forecasting. Investing in a formal CS Ops team provides critical insight into the customer base and allows the CS leader to focus on strategy and customer outcomes.
Late Stage ScaleUp Example
Investors look to sustainable growth in metrics after the business has achieved scale. We invest in reliable compounders with favorable margins. Optimize for metrics that prove you can be profitable while growing consistently and reliably.
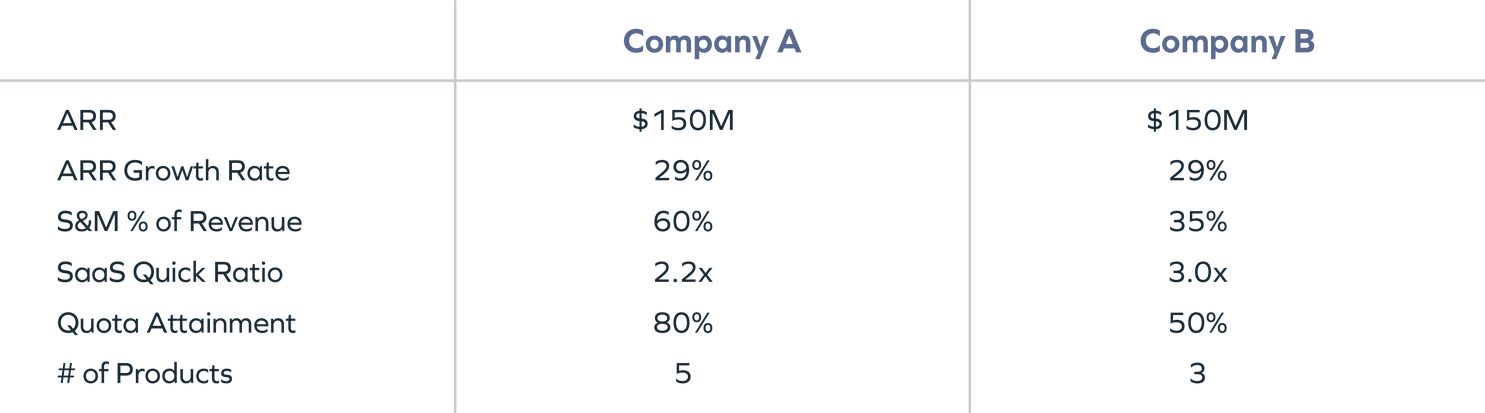
At first glimpse, these two companies look to be roughly equal. They have the same ARR and growth rate. Company A has better Quota Attainment and more products (indicating more potential for cross-sell) while Company B has lower S&M as a % of Revenue and a better SaaS Quick Ratio. There are positives and negatives with both companies that we have to consider as investors.
Company A is spending almost double Company B on S&M, which may be due to their inability to set reasonable sales targets for their team. 80% of sellers hit their sales target, which means they are incurring higher commission costs as accelerators kick in, driving up sales expense.
However, the SaaS Quick Ratio is the biggest red flag for Company A. With a ratio of 2.2x, Company A is losing more revenue to churn and downsell as compared to Company B, meaning sales has to work harder to maintain that high-20's ARR growth.
Although Company B has fewer reps achieving quota and the same ARR growth rate, they do so with a more efficient sales and marketing organization that loses less of their existing revenue. They have all the indications of a company that can drive efficient, repeatable, and consistent growth.
Late Stage Summary
The best Late Stage ScaleUps with the highest valuations cross $100M in ARR growing at >50% with less than a 12-month CAC Packback, a SaaS Quick Ratio of 4x+, moderately distributed Quota Attainment, and a path to Sales & Marketing Expense becoming less than 50% of Revenue. These companies command the highest ARR valuation multiples because they've proven they can scale efficiently, maintain growth rates at scale, and have strong long-term profit margin potential.
Conclusions
Metrics should be right-sized for your stage of growth to serve as indicators of the health of your company - and its future potential. Investors view each metric as a window into your ability to build a GTM motion that scales efficiently because of solutions that delight customers and unit economics that are sustainable over your ScaleUp journey.
If you manage to the metrics, understanding their implications on valuation, you'll set yourself up to raise more capital, whether from venture or private equity investors, or from public markets. Your metrics paint a story for investors: VC and public investors care more about the growth story, while private equity investors care more about a mix of profitability and growth.
Your metrics are used to quantify the growth story, paint the total addressable market (TAM) picture, understand your momentum, and illustrate the next horizon for your business.
Originally published by Insight Partners via Ceros.